

Guiding the user consists of explaining what can be found through the web interface. At the moment the web interface should speak for itself since it’s not terribly complicated but this guide will help if you are having any issues.
Besides browsing through individual experiments, searching is the only way to find the entity you desire. Knowing how it works is essential.
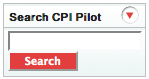
Above the left side menu you will see the search bar. This search is highly flexible and finds any entity containing your search string. These entities currently include Genes, Targets, Reagents, Phenotypes and Experiments.
The results on the search depend on the number of entities and the number of types of entities found:
if multiple types of entities are found then the number of each type of entity found is shown, and clicking on the entity type yields a list matching the search criteria (as in the the next example).
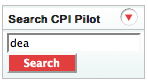

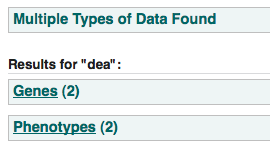
click here to perform this search.
if multiple hits for one type of entity are found then a list matching the search criteria will display.
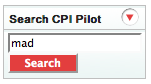
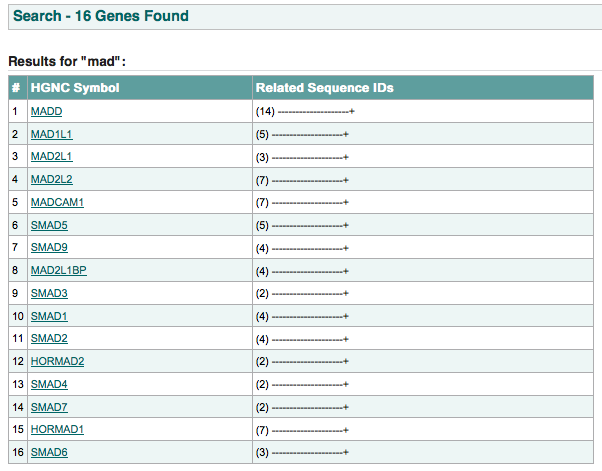
click here to perform this search.
if only one entity matches the search criteria then the entity page will display.
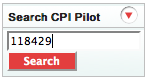
click here to perform this search.
this page shows:
All of the related entities are internally linked (light blue text) and clicking on any one of them will take you to the respective entity page.
An example of the gene page is shown below:
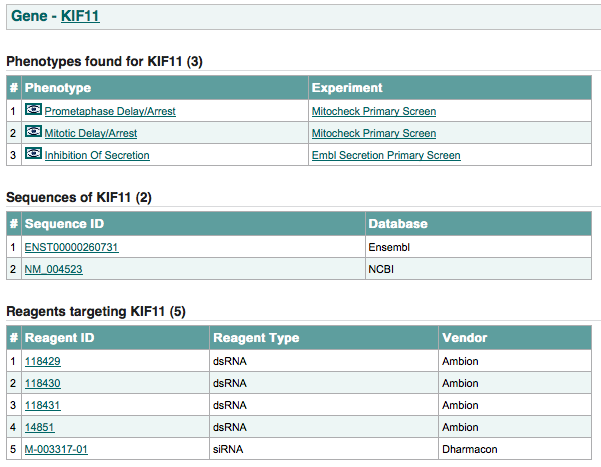
this page shows:
An example of the target page is shown below:
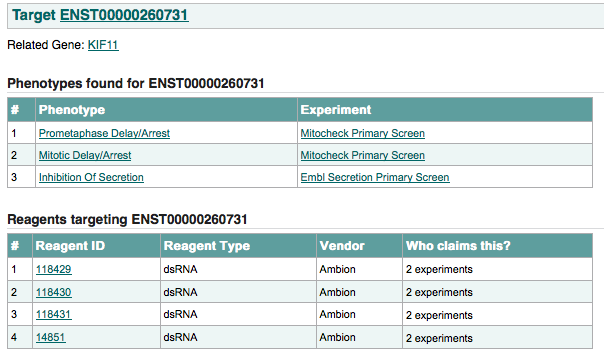
this page shows:
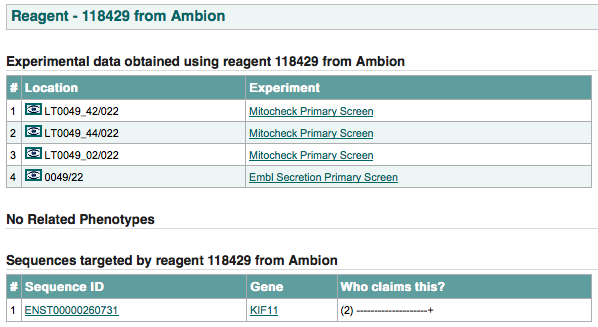
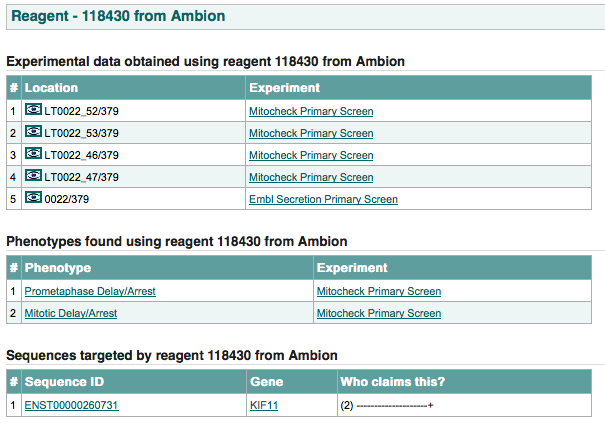
all the experimental data obtained using this reagent:
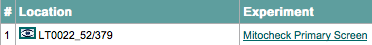
the data source location column contains within it an image of an eye which, if clicked, links to the location’s data.
phenotype hits given by different experimenters for this reagent.
all the transcripts transcripts targeted by this reagent and which experimenters claim this relationship.
An example of the target page is shown below:
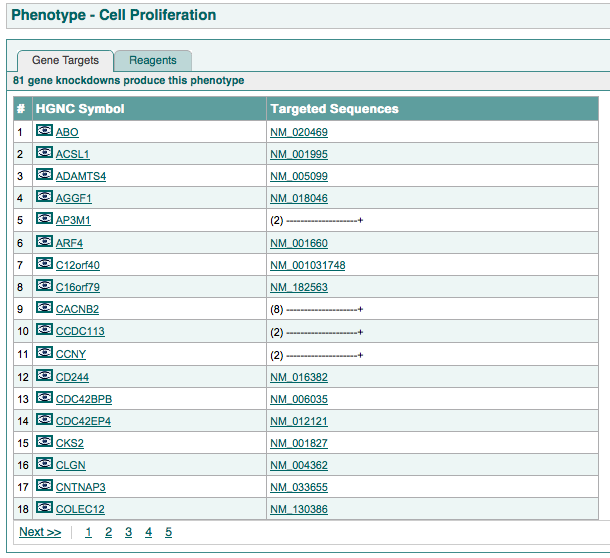
this page is split into two tabs:
The first tab shows:
An example of this page is shown below:
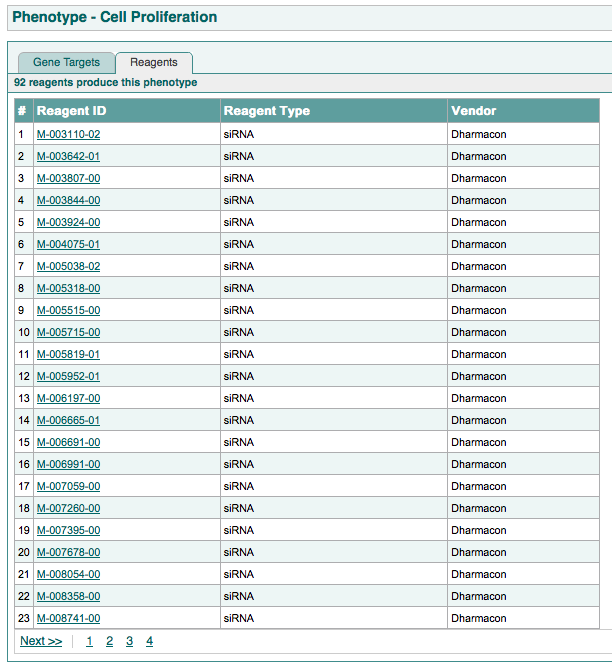
The second tab shows all reagents that produce the phenotype.
An example of this page is shown below:
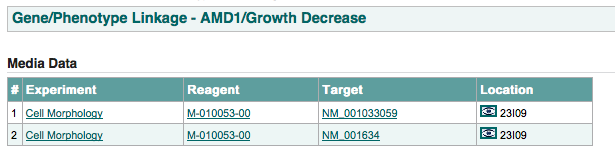
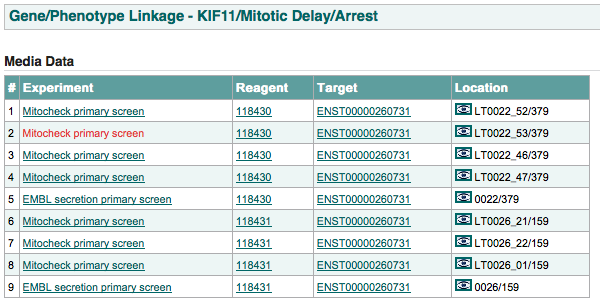
for a specific gene and a specific phenotype, this page links to all the raw data that link the gene to the phenotype. This includes which reagent is producing the phenotype and which targets related to the gene those reagents target.
An example of this page is shown below:
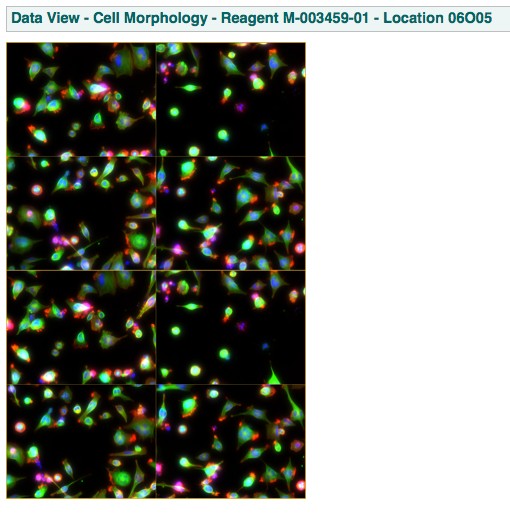
this page shows the image/movie data extracted from one well. This may or may not be the raw data due to web viewing efficiency concerns. An example of this page is shown below:
this page shows:
An example of this page is shown below:
A biologist can immediately check what phenotypes have been found for his gene of interest by searching for the gene using its HGNC symbol, Ensembl Transcript ID or NCBI refseq ID. The gene page will list the phenotype hits across all experiments and by clicking on the eye image in the phenotype column, a list showing the location of every phenotype hit for the gene in every experiment is displayed. An example of this page is shown below:
Browsing through this list by clicking again on the eye but this time in the location column will take the user to the data (images/movies) found extracted during the experiment at that location. This means a biologist has quick an easy access to cellular phenotype hits for his gene of interest and can verify that these hits meet his expectations by reviewing the original data.
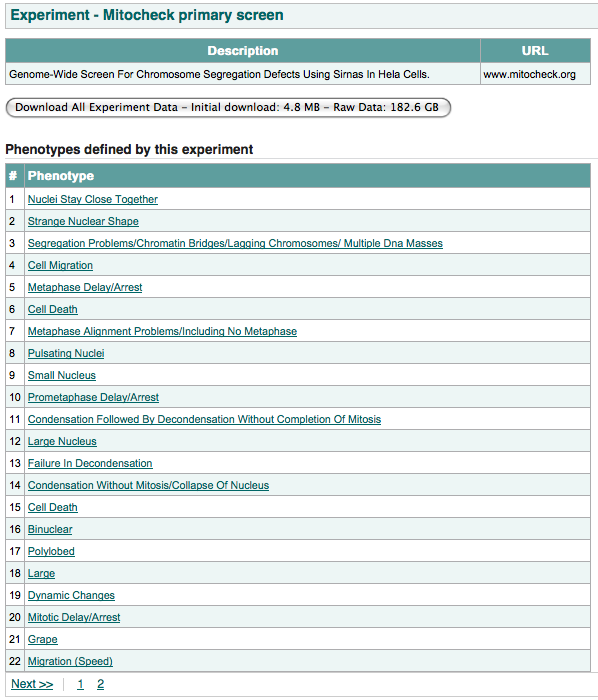
By either searching for the experiment name or browsing through the experiments listed through the Browse Experiments link located on the sidebar, a user might be able to locate an experiment that is of interest to him. The experiment page of interest will show a list of phenotypes. Clicking on a phenotype will take the user to the phenotype page, and from there it is possible to get to example experimental data by clicking on the eye image twice (on the phenotype page and on the following page). If a user is satisfied with the quality/relevance of the data then he can download all the raw data for that experiment for re-analysis (see Downloading Experimental Data).
Although infrequent, a user may want to find the genes/transcripts said to be targeted by a certain reagent. Browsing by phenotype can also be an option.
On the experiment page, clicking on the “Download All Experiment Data” initiates a single zip file download which, when unzipped, will contains three sub folders:
At the moment a terminal/command line program called wget is used to do this. wget is very slow as in this application it goes through HTTP and a meeting is being setup with systems to discuss other transfer possibilities.
Once downloaded, the raw files will be stored in the hierarchy that they were when they were originally submitted by the experimenter. The file location can be retrieved from the data.csv file in the /export folder given the experimental location.